Metaphor is important in science. We need a picture in our mind, for ourselves and so we can share it with others. We need a picture even when there can be no true picture, as for atoms and in quantum mechanics. Our brains are analogue processors. We might believe the result of a complex digital calculation but we can’t visualise the answer, except as analogue. The very basic idea of analogue is to model a complex situation so as to be able to analyse it.
The icon of analogues is the slide rule. Numbers are replaced by lengths and the scales are compressed by logarithms. As chemistry students, we slung slide rules in our pockets as student doctors hung stethoscopes around their necks.
Logarithmic compression is a fact of life, not just a handy invention. All our biological sensors are logarithmic. Hearing (decibels), light (lux), intensity of spices (scovilles). How else could our senses encompass magnitudes ranging a millionfold?
Our response to drugs has the dose plotted logarithmically (LD50). We also compress our manufactured sensors – think earthquakes (Richter scale) and acidity (pH). Even economists do it logarithmically (marginal utility).
Curta slide rule
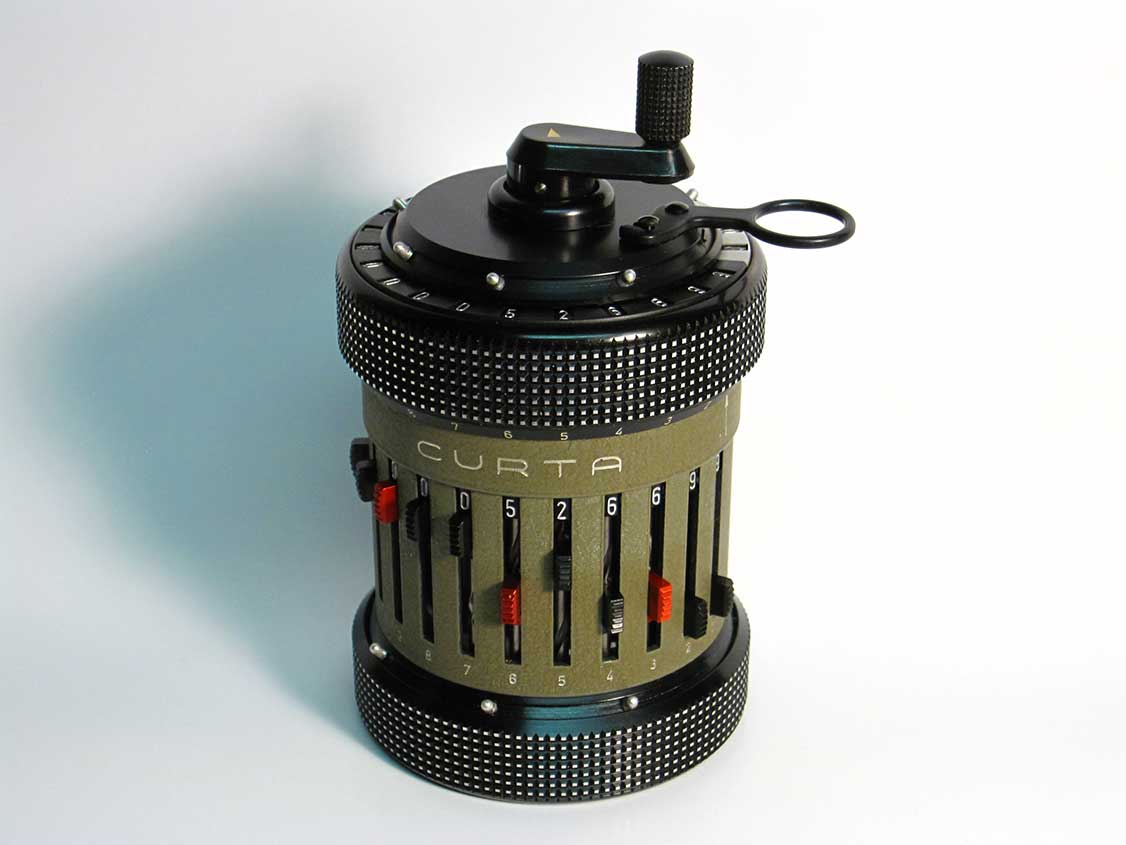
In 1947 came an upmarket slide rule, the Curta, invented by Austrian Curt Herzstark. This cylindrical mechanical calculator had a beautiful form and has a fascinating history. It looked something like a wide coffee or pepper grinder that fitted neatly into the palm of one hand. There was only a single Curta at Sydney University Chemistry in the late 1950s. We touched it with awe. The Curta survived until the early 1970s because of a precision of 11 or 15 significant digits, only then matched electronically.
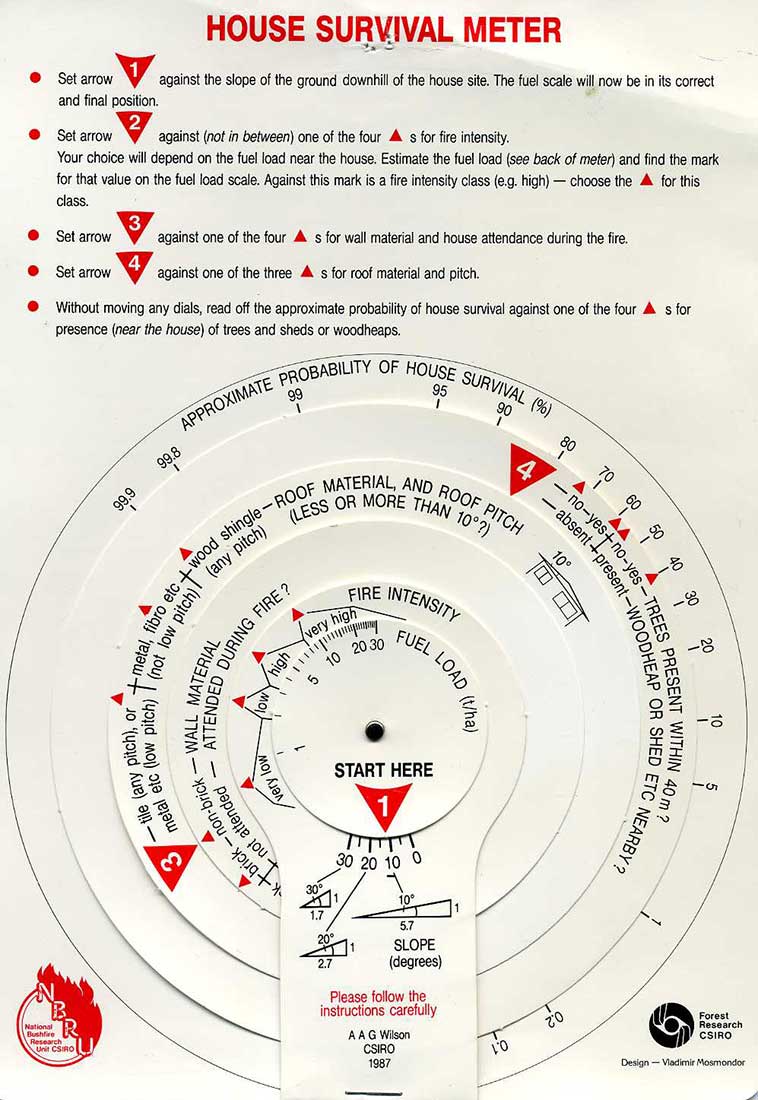
While the slide rule was a general-purpose device, dedicated graphical analogue devices were developed for specific complex situations. One from CSIRO in the 1980s allowed calculation of the risk to a house from bushfire. Another, from my work with vacuum pump systems, provided (inter alia) the distance moved by a gas molecule before colliding with another as dependent on the degree of vacuum obtained by a pump – essential for studying radiationless electronic energy decay.
Some, like that from the erstwhile Commercial Banking Co of Sydney (now NAB), were very simple converters. Long before unit pricing, they allowed various package sizes to be compared for price.
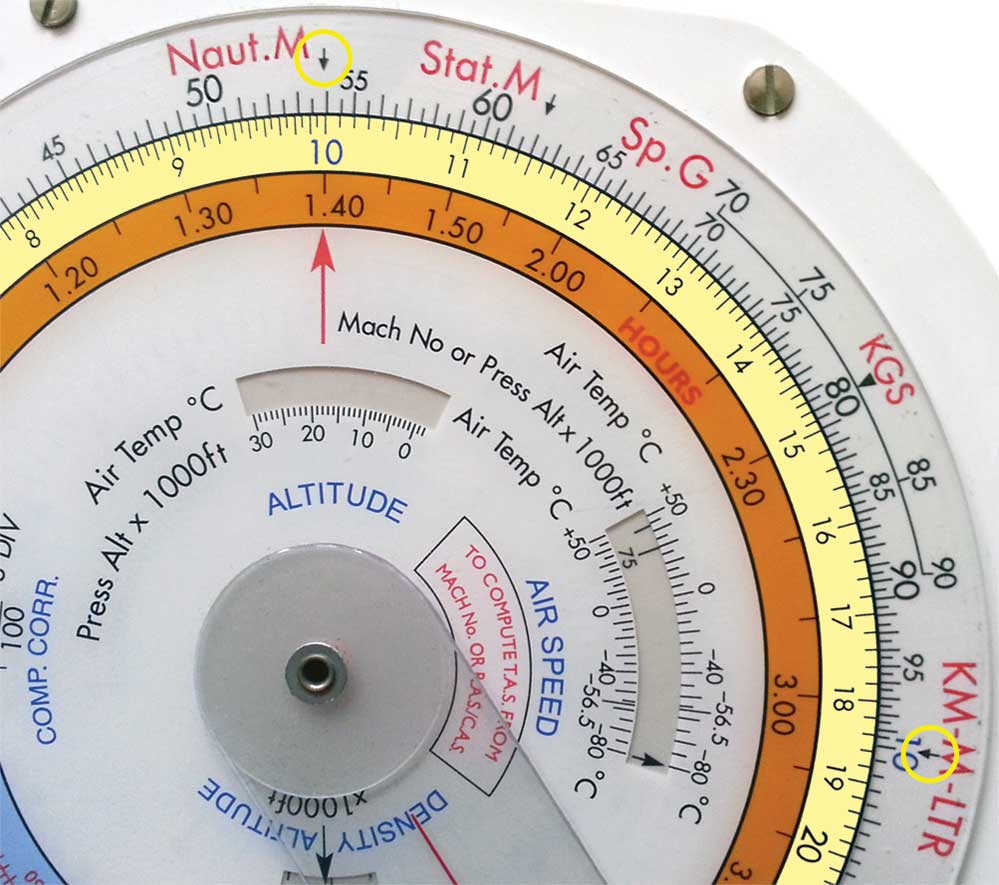
My Jeppesen slide graphic computer for aircraft navigation was a present from an engineering friend. Even in today’s digital world, the aircraft data presentation is analogue. Doomed Dreamliner pilots might well have wished they had one.
I was overjoyed to receive my first (teaching) analogue electronic computer (differential analyser) at ANU. Instead of converting numbers into lengths on a ruler (as per slide rule), this machine converted numbers into voltages. At its heart was an electronic chip for very high gain amplifiers. By providing feedback from the output to the input via resistors or capacitors, the chip would either add voltages or integrate them. By connecting the chips via a spaghetti of wires, any differential equation (algebraically solvable or not) could be simulated and the result displayed. The early nuclear reactors were modelled this way, but our applications were more benign, mainly chemical (and biological – Michaelis–Menten) kinetics and quantum mechanics (finding eigenfunctions for a particle in a box that could be changed smoothly from rectangular to parabolic and then place a bump in the middle (e.g. ammonia)).
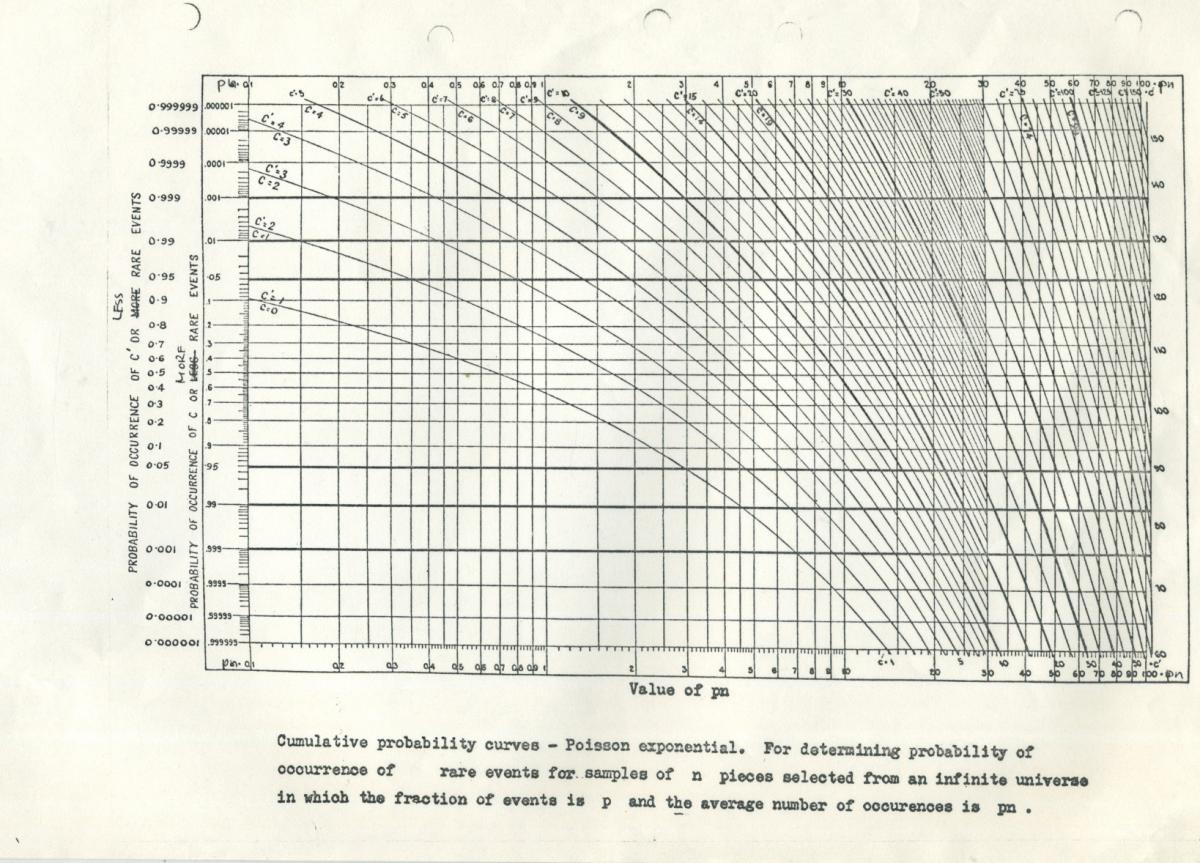
Probes, photons and Poisson
I met my first nomogram on a page from a book my father had enlarged and copied over and over again for his student lectures on production engineering quality control at Sydney Technical College (now University of NSW). He gave me the book, saying, ‘In stats, you know, it’s the future’. The nomogram was a Poisson distribution.
As it turned out, this distribution was to lead to an experiment that halved the time I needed for my doctorate in Stuttgart, Germany (Poisson distribution of fluorescent probes in soap micelles – invisible microspheres of soap molecules suspended in water, in 1964). The second was in an entirely different application, whereby I was analysing and fitting single photon fluorescent decay data in my research at Minneapolis, USA (in 1969), assuming the same Poisson statistics.
Most dramatically, when I met my future wife at Prince Henry Hospital, she was doing a blood count, counting red blood corpuscles in diluted blood under a microscope with a Coulter counter. The counter was a microscope slide with a rectangular grid in which the blood cells were distributed in number per square, in exactly the same way as fluorescent probes were distributed in number in (invisible) soap micelles.
Testing probabilities
A currently popular nomogram is based on Bayes theorem. This nomogram has three scales arranged so that if you know the values of two of the variables, you can obtain the value of a third (on its scale) by running a straight line between the two known points to intercept the third scale. A search on Google for ‘nomogram’ brings up mostly medical diagnostic and surgical option optimising uses (e.g. www.barbecuejoe.com/scan.htm).
Nomograms for mammograms
Consider a woman in her 40s or 50s with no family history of breast cancer. Women in this group have a probability of having breast cancer of 0.8%. If a woman from that cohort really has breast cancer, the probability is 90% that she will have a positive mammogram. If a woman does not have breast cancer, the probability is 7% that she will have a positive mammogram.
Now, one of the women in this cohort has a positive mammogram; what is the probability that she has breast cancer? An international survey of doctors gave answers ranging virtually across the whole percentage range. (Answer at the end of the article!)
The nomogram exposes the error of emphasising the test performance while ignoring the population base and prevalence of disease.
Nomograms for COVID-19 testing regimes are now appearing (e.g. Watson J., Whiting P.F., Brush J.E. BMJ 2020, doi: 10.1136/bmj.m1808).
Crime scene investigation
Forensic scientists have been testing and arguing about the value of this Bayesian approach on crime scene investigations. With DNA identification, the odds ratios are so high, it is with incidental failure/perversion of process where any error will lie.
However, in virtually all other non-DNA evidence situations the questions are again:
- What did we know before? (How many possible suspects? Which database of broken glass samples is appropriate?)
- How good is our test/investigation (likelihood ratio)?
- And what do we know after the investigation? (How far have we narrowed down the suspect list? Is that glass sample unique enough?)
Unlike doctors, the judges and jury in the courtroom are not experts in judging the quality of the argument, but rely on expert witnesses assessing their own evidence. This is a situation with which they are never very happy. Being allowed to play with a ruler crossing three columns with numbers is unlikely to compensate.