In New Zealand in 1975, less than a third of students studying chemistry in the final year of secondary school were female. In that year, only about one in ten of the girls who started secondary school in 1971 was still at school. The situation has changed. In 2014, more than half of the final-year chemistry class in New Zealand was female. Almost nine in ten girls who started secondary school in 2010 remained to the 2014 final year (Year 13).
Enrolment trends are something I have been interested in for some time. I have previously reported trends since 1975 (published in Chemistry in New Zealand and ANZ Physicist*) in the number of New Zealand students studying science.
Each year since 1975, I have updated my database, and this time I decided to see whether the trends in secondary school chemistry in New Zealand are the same as they are elsewhere. As you will see, they are not. I have compared the enrolment and performance of girls studying final-year secondary school chemistry in 2001–13 in New Zealand and five Australian states, and in various examination systems in the UK and Ireland. I leave it to readers and others to try to explain what has been observed.
Rates of change for chemistry enrolments
The number of girls studying final-year secondary chemistry has increased. The table opposite shows that in New Zealand and Queensland, the increase in numbers is significantly greater for girls. (Data in all tables and figures has been sourced from the websites of the relevant examining authorities). For the UK AS and A levels, the increases are similar for both sexes, while elsewhere they are greater for boys.
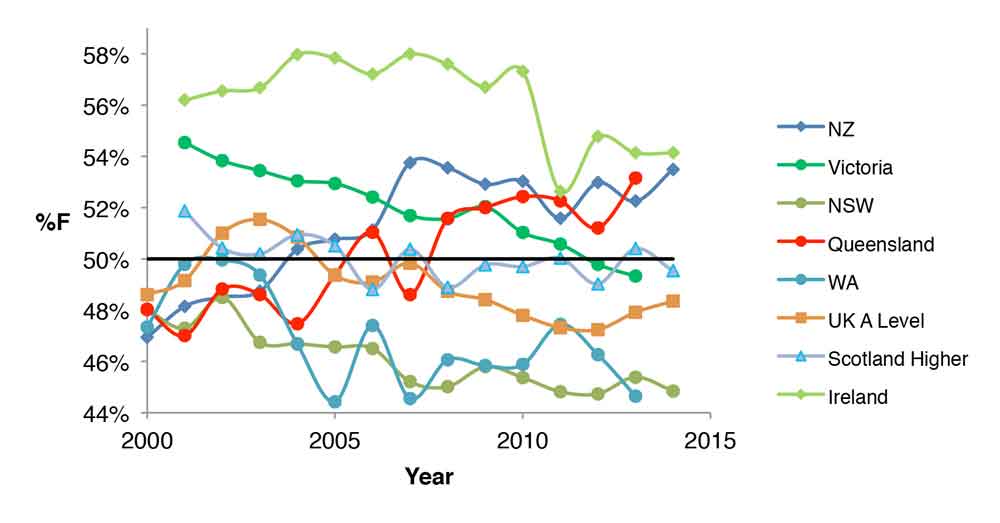
The different rates of increases are reflected in the change over the period 2001–13 in the percentage of girls in final-year secondary chemistry (%F). The changes in %F are shown in the graph on page 24. The %F in Ireland has remained greater than 50%, while in South Australia and Western Australia it has remained less than 50%. In New Zealand and Queensland, the percentage of girls in final-year secondary chemistry has increased markedly to greater than 50%. The increase in %F in Queensland is due to very little change in the number of boys in final-year secondary chemistry, with a linear fit actually giving a decrease of 3.4 male students per year compared with an increase of 80.3 female students per year. By contrast, the larger increase in the number of boys studying final-year chemistry compared with girls in Victoria has led to the %F dropping from 54.5% in 2001 (the largest Australasian %F in 2001) to 49.3% in 2013. In Victoria, it is the girls’ number that has not changed greatly, with a linear fit giving an increase of only 1.4 students per year while the fit to the boys’ data gives an increase of 105.7 students per year. The trends for UK AS levels were the same as for the UK A levels. This is also true for the Scottish Advanced Highers when compared with the Highers. The Scottish Higher was introduced in 2000 and the number taking the Advanced Higher exam was only 592 in 2001 compared with 1769 the following year. With increased competition for places in top universities, I suspect more students are taking AS courses in addition to those they are taking for A levels, since the AS results are sometimes used to determine who receives offers of places. Straight A’s in A levels do not guarantee a place in Medicine
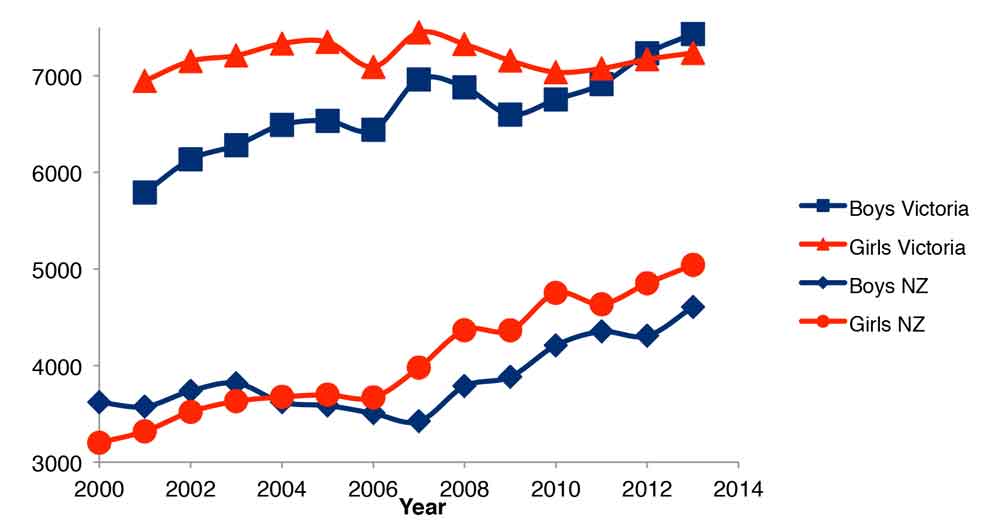
New Zealand and Victoria had similar percentage increases in the number of boys studying chemistry in their final secondary school year but very different percentage increases for girls. The different rates of increase for girls and boys in Victoria and New Zealand are shown in the graph. In New Zealand, the rates of increase have been almost the same since 2006.
Percentage change in chemistry enrolments in New Zealand, Australia (some states), Ireland and the UK 2001–2013
| State/country | Percentage change Boys | Percentage change Girls |
|---|---|---|
| New Zealand | 28.8 | 51.8 |
| New South Wales | 25.1 | 15.8 |
| Queensland | -0.7 | 22.4 |
| South Australia | -13.8 | -12.1 |
| Victoria* | 28.4 | 4.2 |
| Western Australia | 54.2 | 25.4 |
| Ireland Leaving Certificate | 35.7 | 24.8 |
| Scotland Higher | 10.9 | 4.5 |
| Scotland Advanced Higher | 45.0 | 57.0† |
| UK A Level | 39.6 | 32.8 |
| UK AS Level | 122.8 | 102.5 |
*Average of two externally assessed units.
†Data for 2002–13; see text.
Percentages of final-year students studying chemistry
Another measure worth examining is the percentage of students in their final year who are studying chemistry (see following table). In New Zealand, Queensland, Scotland (for the Higher) and Ireland, where the %F was greater than 50%, the percentage of females is greater than the percentage of males. An exception to this pattern is in South Australia where there is a greater percentage of females in the final year studying chemistry but the %F is less than 50%.
Percentage of final year candidates studying chemistry in New Zealand, Australia (some states), Ireland and the UK in 2013
| State/country | Boys (%) | Girls (%) |
|---|---|---|
| New Zealand | 19.0 | 19.3 |
| New South Wales | 16.6 | 13.2 |
| Queensland | 18.9 | 20.8 |
| South Australia | 9.7 | 10.3 |
| Victoria | 19.8 | 17.4 |
| Western Australia | 23.3 | 19.5 |
| Ireland Leaving Certificate | 11.6 | 14.0 |
| Scotland Higher | 18.0 | 18.7 |
| Scotland Advanced Higher | 22.6 | 17.7 |
| UK A Level | 6.9 | 5.4 |
| UK AS Level | 7.0 | 5.7 |
Exam performance
The table on page 25 shows data for the relative performance of girls and boys in final year secondary chemistry in 2013. Each state or country has a different grading scheme, with the number of points varying from the New Zealand NCEA’s E(xcellent), M(erit) and A(chieved) to South Australia’s nine-point A+ to C–. In columns 3 and 4 are the percentages achieving the highest grade (or in South Australia’s and Ireland's cases, the highest two grades). In columns 6 and 7 are the percentages achieving grades that include up to about 50% of candidates. In Victoria, the UK at both A and AS levels, and Ireland, a higher proportion of girls have higher grades in chemistry than boys. In Scotland, the performance of girls and boys is essentially the same in the Higher exam, but the boys perform better in the Advanced Higher. New Zealand boys perform better than girls in the standard ‘Demonstrate understanding of equilibrium principles in aqueous systems’, which involves some more quantitative questions.
Why the difference in performance? Is it the syllabus, especially its relevance, or the type of examination questions or their difficulty? Peer expectations and different levels of confidence may also play a part. It is unlikely to be a difference in teacher quality between different states or countries, although that could be a factor between different schools.
Comparison of percentages of males and females achieving high grades in 2013 chemistry examinations
| Grade(s) | Male (%) | Female (%) | Grade(s) | Male (%) | Female (%) | |
|---|---|---|---|---|---|---|
| New Zealand NCEA Level 3†‡ | E | 7.7 | 8.4 | E+M | 34.1 | 35.3 |
| Queensland§ | VHA | 15.1 | 15.9 | VHA + HA | 46.1 | 53.5 |
| South Australia | A+/A | 12.8 | 13.9 | A+–B+ | 42.1 | 48.0 |
| Victoria | A+ | 9.7 | 8.4 | A+–B | 48.8 | 46.0 |
| Western Australia | A | 26.0 | 26.3 | A + B | 48.2 | 51.3 |
| Ireland Leaving Certificate | A1/A2 | 21.7 | 19.5 | A1–B3 | 49.7 | 47.3 |
| Scotland Higher | A | 31.7 | 31.7 | A–B | 55.4 | 55.3 |
| Scotland Advanced Higher | A | 35.0 | 30.4 | A–B | 62.8 | 57.6 |
| UK A Level | A* | 9.1 | 7.4 | A* + A | 34.0 | 33.1 |
| UK AS Level | A | 20.9 | 20.8 | A–B | 41.4 | 41.9 |
†Average of three externally assessed standards.
‡In New Zealand, the grades are (E)xcellence, (M)erit and (A)chieved.
§In Queensland, the achievement levels are (V)ery (H)igh (A)chievement, (H)igh (A)chievement,
Sound Achievement, Limited Achievement, Very Limited Achievement.
Examining authority makes a difference
With the exception of South Australia, the number of girls studying chemistry in their final secondary school year is increasing in all of the places for which data was collected. The percentage of girls in the final secondary year studying chemistry has increased for some places/examining authorities but decreased in others. This percentage varies significantly from examining authority to examining authority for reasons that are not obvious. If the goal is to have equal numbers of boys and girls, then there is some comfort in the situation being better for chemistry than physics or biology. In some examining systems, girls perform better than boys and in others the reverse is true. Plenty of questions remain begging to be answered.